Phase Diagrams
The phase of a subtance (solid, liquid, gas) depends on its temperature and pressure.
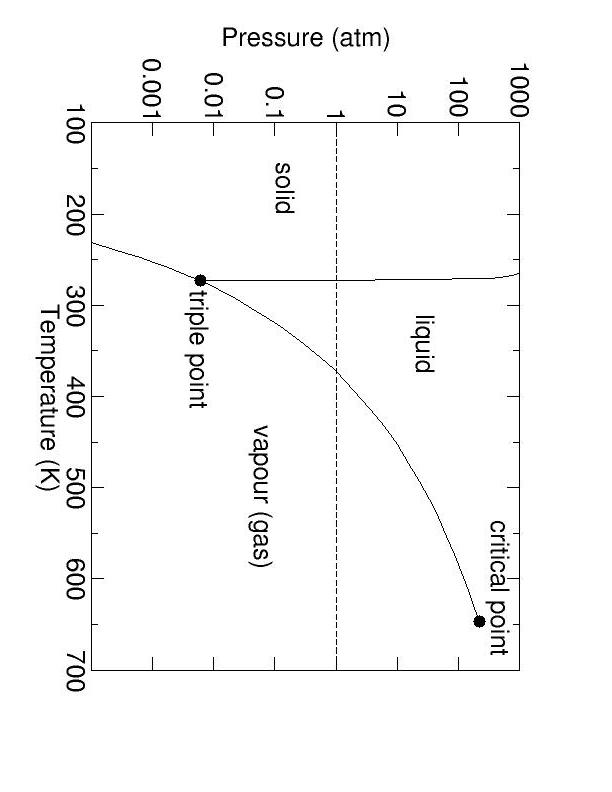
phase diagram: a graph showing the phase(s) present at different temperatures and pressures.

fusion curve: the set of temperatures and pressures at which a substance melts/freezes. (Curve AD on the graph)
vaporization curve: the set of temperatures & pressures at
which a substance vaporizes/condenses. (
sublimation curve: the set of temperatures & pressures at which a substance sublimes/deposits. (Curve AC on the graph.)
triple point: the one temperature and pressure at which a substance can exist simultaneously as a solid, liquid, and gas. (Point A on the graph.)
critical point: the point on the vaporization curve that corresponds to the highest temperature at which the substance can exist as a liquid. (Point B on the graph.)
Phase Diagram for H2O